logo
Simplify markets. Amplify results.
Track your portfolio, screen winning stocks, and make smarter moves — all in one powerful SaaS platform.
dashboard

Portfolio Tracking

Track all your assets in one place, view performance metrics, historical trends

Stock screener

Go beyond simple ratios. Filter and rank stocks by Annualized TSR, Max Drawdown, Volatility, and more to uncover steady winners and avoid risky picks—all in a few clicks.

Market News

Stay ahead of the curve with a personalized news feed that aggregates the latest financial headlines, earnings reports, macroeconomic updates, and sector-specific stories.
coding

Stock Insights Dashboard

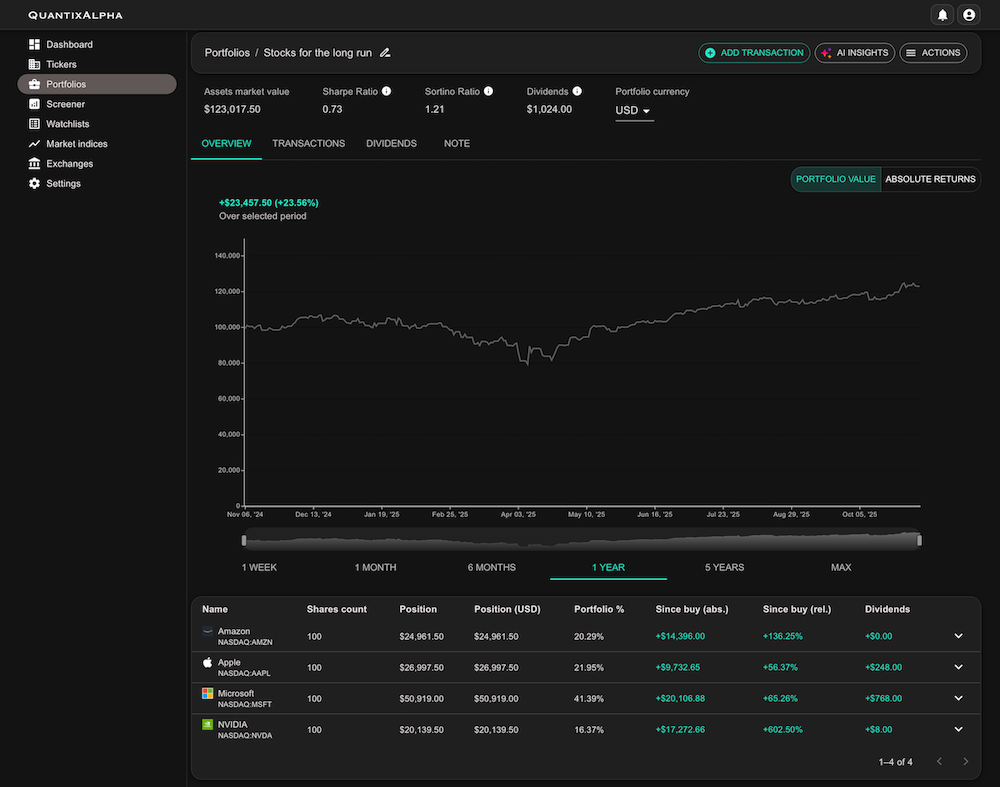
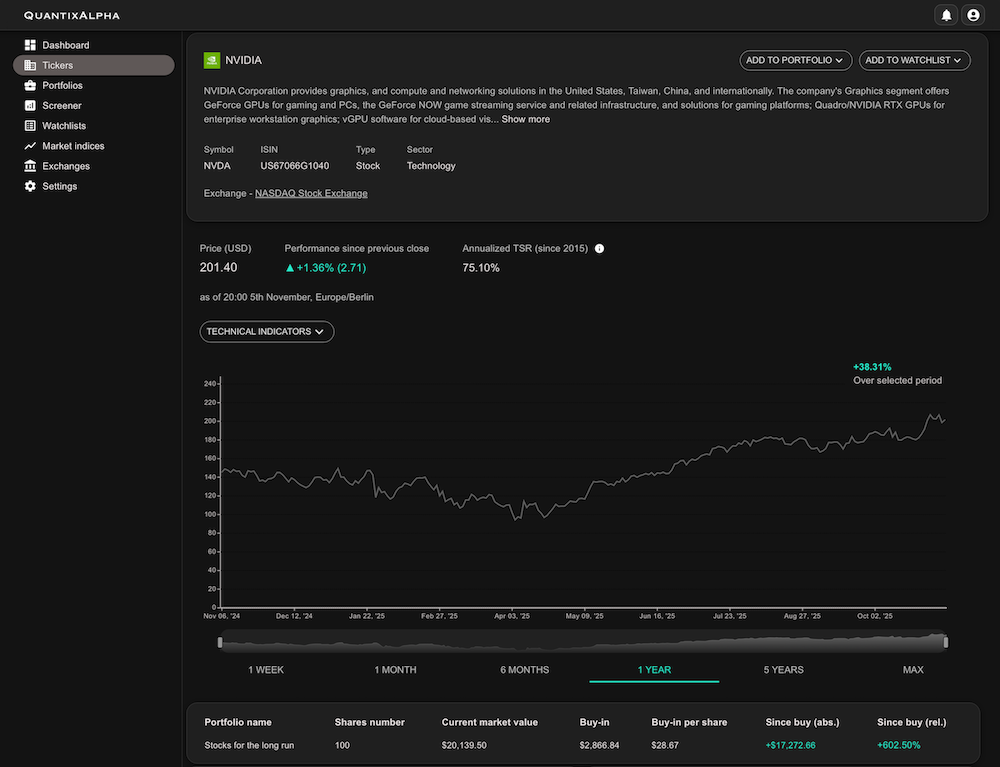
Historical Stock Price Data

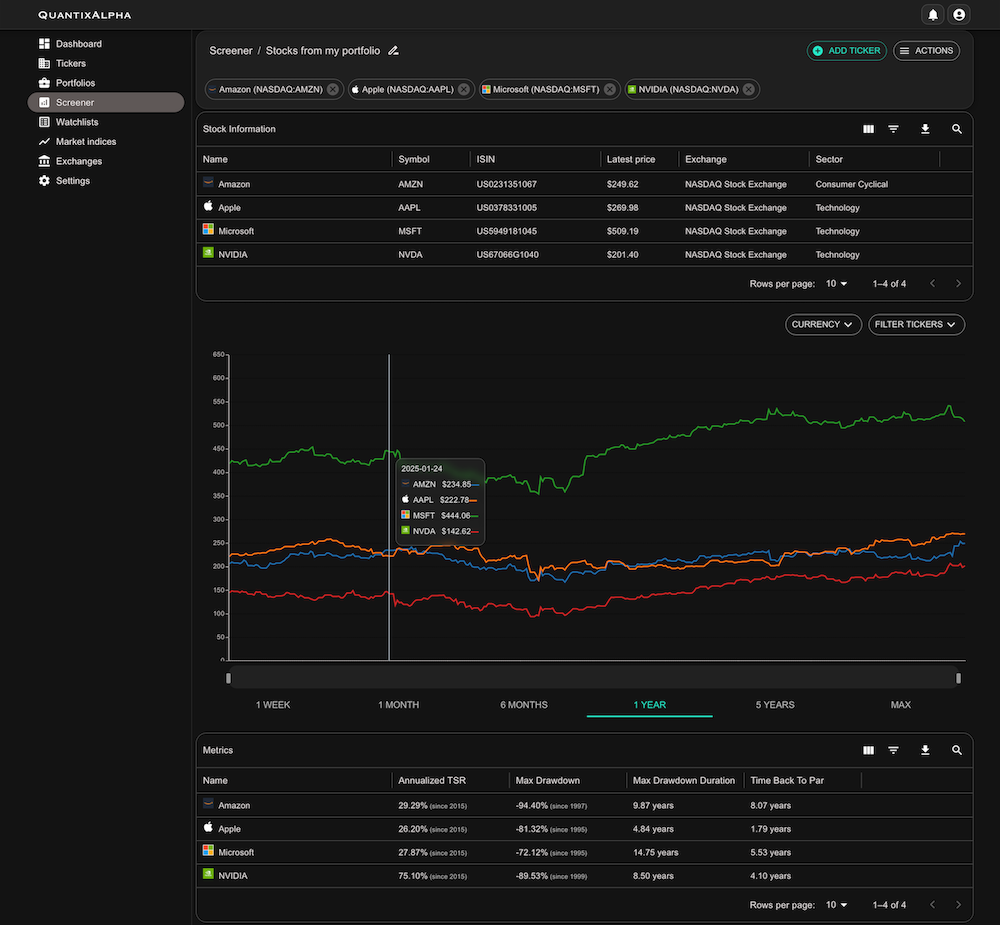
View daily, weekly, or monthly closing prices, presented in interactive charts and downloadable tables. Analyze trends over customizable time ranges, from the past week to decades of data.

Stock Splits And Dividend History

Stay informed about past and upcoming stock splits, complete with split ratios, effective dates, and their impact on historical pricing. Explore a full timeline of dividend payouts, including amount per share, ex-dividend dates, payment dates, and yield calculations.

Latest News

Stay up-to-date with real-time news headlines, press releases, and SEC filings relevant to the selected ticker.

Stock screener

Annualized TSR (Total Shareholder Return)

Measures a stock's average yearly return, including both price appreciation and dividends. It gives you a complete picture of how effectively a company has rewarded its shareholders over time.

Max Drawdown

Shows the largest percentage drop from a stock's peak to its lowest point within a selected period. It helps you understand potential downside risk and how much a stock could fall during market stress.

Volatility

Tracks how much a stock’s price fluctuates over time. Higher volatility means bigger swings—both up and down—while lower volatility signals more stable performance.
coding
coding

Portfolio Tracking

Stocks Portfolio Tracking

Effortlessly monitor your investments with real-time portfolio tracking. Stay on top of your assets from global exchanges, analyze performance, and keep tabs on your gains—all in one place.

Risk-Adjusted Performance

Evaluate how efficiently your portfolio generates returns relative to risk. The Sharpe Ratio measures overall risk-adjusted performance, while the Sortino Ratio focuses on downside risk—together helping you understand both the rewards and the potential pitfalls of your portfolio.

Watchlists

Create personalized watchlists to track stocks you're interested in. Organize and follow market movements, price changes, and trends—tailored to your investment strategy.

Pricing

Free

Basic subscription


  • 2 portfolios
  • 2 watchlists
  • Screener - up to 5 tickers per screen
Get now

$10 /mo

Pro subscription


  • Up to 20 portfolios
  • Up to 20 watchlists
  • AI Insights
  • Screener - up to 20 tickers per screen
Get now

Faq

Is the Basic subscription available at no cost?
Yes. It is completely free, no credit card required.
AI Insights
AI Insights uses advanced LLM-powered analysis to automatically summarize your portfolio’s performance, diversification, and risk profile — in plain English.
Still have questions?
Contact